


The enterprise intelligence landscape has undergone a fundamental transformation. Organizations are no longer content with retrospective analysis or periodic reporting cycles. Instead, they demand instantaneous visibility into operational metrics, predictive insights that anticipate market shifts, and automated responses that execute decisions at machine speed.
With AI investment remaining strong in 2025, enterprises are placing sharper emphasis on using AI for operational scalability and real-time intelligence. 72% of organizations have now adopted generative AI in at least one business function, and this adoption is fundamentally reshaping how enterprises consume, analyze, and act on information. The global real-time dashboard market, valued at approximately $12 billion in 2023, is projected to reach $32 billion by 2032, growing at a compound annual growth rate of 11.5%—a trajectory that underscores the critical role these systems play in modern business operations.
Real-time intelligence dashboards have emerged as the operational command centers for this AI-driven enterprise, consolidating data streams, surfacing actionable intelligence, and enabling decision-making that occurs at the speed of business. This article examines the architecture, applications, and strategic implications of real-time intelligence dashboards as they become the nervous system of next-generation organizations.
2. From Reactive Reporting to Predictive Intelligence: The Evolution of Business Intelligence Systems
Traditional business intelligence systems were built on batch processing architectures that ingested data in scheduled intervals—hourly, daily, or weekly. These systems provided valuable historical context but operated with an inherent latency that limited their utility for time-sensitive decisions. The paradigm was fundamentally reactive: analyze what happened yesterday to inform decisions for tomorrow.
Real-time intelligence dashboards represent a categorical shift in this model. Rather than processing data in batches, these systems operate on streaming architectures that ingest, process, and visualize data continuously. The distinction extends beyond mere speed. Traditional BI systems answered questions about the past. Real-time intelligence dashboards illuminate the present and predict the future.
The architectural transformation reflects this evolution. Legacy systems relied on extract-transform-load processes that consolidated data from operational systems into data warehouses optimized for analytical queries. This approach introduced multiple stages of latency—data extraction delays, transformation processing time, and loading cycles—that could span hours or days.
Contemporary real-time dashboards implement event-driven architectures where operational data flows directly into streaming platforms. These systems process data in-flight, applying transformations, aggregations, and analytical models before data ever reaches persistent storage. The result is intelligence that reflects the current state of operations with latencies measured in seconds or milliseconds rather than hours.
The shift from reactive to predictive intelligence represents the most significant dimension of this evolution. Traditional dashboards displayed metrics—revenue figures, customer counts, operational KPIs. Real-time intelligence dashboards integrate machine learning models that analyze patterns, detect anomalies, and generate predictions. A financial services dashboard no longer simply displays transaction volumes; it predicts fraud likelihood for each transaction and automatically flags suspicious patterns. A supply chain dashboard does not merely show current inventory levels; it forecasts demand surges and recommends preemptive replenishment.
This transition from descriptive to predictive analytics fundamentally alters the role of business intelligence in organizational decision-making. Where traditional systems supported human judgment with historical context, real-time intelligence dashboards augment human cognition with machine-generated insights and, increasingly, automate routine decisions entirely.
3. The Technical Architecture: Building the Real-Time Intelligence Pipeline
The technical foundation of real-time intelligence dashboards consists of several integrated layers, each addressing specific requirements of streaming data processing, inference execution, and responsive visualization.
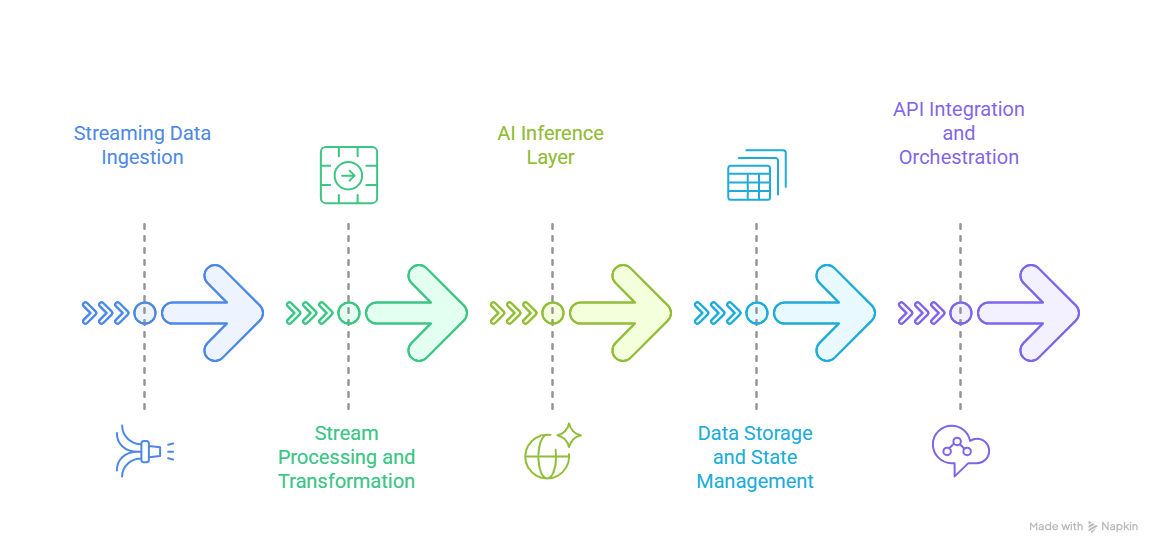
3.1 Streaming Data Ingestion
The data ingestion layer captures events from operational systems as they occur. Apache Kafka has emerged as the de facto standard for this layer, providing a distributed event streaming platform that can handle millions of events per second with fault tolerance and ordering guarantees. Kafka's publish-subscribe model enables multiple downstream consumers to independently process the same event stream, supporting diverse analytical requirements without creating load on source systems.
Alternative platforms including Amazon Kinesis, Azure Event Hubs, and Google Cloud Pub/Sub provide similar capabilities with tighter integration into their respective cloud ecosystems. The selection criteria typically balance throughput requirements, latency tolerances, operational complexity, and existing infrastructure investments.
3.2 Stream Processing and Transformation
Raw event streams require transformation before they can support analytical queries or feed machine learning models. Stream processing frameworks including Apache Flink, Apache Spark Structured Streaming, and ksqlDB provide the computational layer for these transformations.
These frameworks enable continuous queries that aggregate metrics over sliding time windows, join streams with reference data, and enrich events with contextual information. The processing occurs in-memory, maintaining state across events while providing exactly-once processing semantics that ensure analytical accuracy.
3.3 AI Inference Layer
The integration of machine learning models into the streaming pipeline transforms real-time dashboards from passive monitoring systems into active intelligence platforms. This layer executes model inference on streaming data, generating predictions, classifications, and anomaly scores that feed directly into dashboard visualizations.
TensorFlow Serving, PyTorch Serve, and MLflow provide model serving infrastructure optimized for low-latency inference at scale. These platforms handle model versioning, A/B testing, and canary deployments, enabling data science teams to iterate on models without disrupting production systems.
The architectural challenge lies in balancing model complexity against latency requirements. Complex deep learning models may provide superior accuracy but introduce milliseconds or seconds of inference latency that accumulates across processing pipelines. Organizations frequently deploy ensemble approaches, using lightweight models for real-time classification and more sophisticated models for periodic batch retraining.
3.4 Data Storage and State Management
Real-time systems must balance competing storage requirements. Time-series databases including InfluxDB, TimescaleDB, and Prometheus provide optimized storage for metric data, supporting the high-write throughput and temporal queries that dashboard visualizations require.
Complementary systems handle different storage needs. Redis or Apache Ignite provide in-memory state management for session data and aggregations. Snowflake, BigQuery, or Databricks serve as the analytical data warehouse for historical analysis and model training.
3.5 API Integration and Orchestration
Modern dashboards aggregate data from numerous sources—internal operational systems, third-party APIs, market data feeds, and IoT sensor networks. API integration layers mediate these connections, normalizing data formats, handling authentication, implementing rate limiting, and providing fallback strategies when external services experience outages.
GraphQL has emerged as an efficient protocol for dashboard data APIs, enabling clients to precisely specify required data fields and reducing over-fetching. This efficiency proves critical for dashboards that update multiple visualizations simultaneously.
4. Domain-Specific Applications: Real-Time Intelligence Across Industries
The architectural flexibility of real-time intelligence dashboards enables tailored implementations across diverse operational contexts.
4.1 Pharmacovigilance Monitoring
Pharmaceutical organizations deploy real-time dashboards for post-market surveillance of drug safety signals. These systems ingest adverse event reports from multiple sources—electronic health records, patient portals, social media monitoring, and regulatory submissions. Natural language processing models extract structured information from unstructured reports, while statistical algorithms detect unusual patterns that may indicate emerging safety concerns.
The dashboards surface these signals to pharmacovigilance teams with contextual information—geographic distribution, demographic patterns, temporal clustering, and comparisons against historical baselines. Automated alerting triggers investigative workflows when signal strength exceeds predefined thresholds, accelerating the identification of serious risks.
The operational impact is measured in patient safety outcomes. Traditional pharmacovigilance systems operated with reporting lags measured in weeks or months. Real-time dashboards compress this timeline to days or hours, enabling faster interventions that prevent patient harm.
4.2 Hospital Operations Analytics
Healthcare delivery organizations implement real-time dashboards for operational command centers that optimize resource allocation across emergency departments, operating rooms, and inpatient units. These systems integrate data from admission systems, electronic health records, nurse call systems, medical devices, and environmental sensors.
Predictive models forecast admission volumes, estimate patient length of stay, and identify patients at risk for clinical deterioration. Optimization algorithms recommend bed assignments, staff scheduling adjustments, and equipment positioning to balance capacity against anticipated demand.
The dashboards provide hospital administrators with comprehensive situational awareness—current bed occupancy, staffing levels, equipment availability, and predicted bottlenecks. Automated alerts notify managers of capacity constraints before they impact patient care, enabling proactive interventions rather than reactive crisis management.
4.3 Adaptive Learning Dashboards
Educational institutions deploy real-time dashboards that monitor student engagement and learning outcomes across digital learning platforms. These systems track metrics including session duration, content interaction patterns, assessment performance, and help-seeking behavior.
Machine learning models identify students exhibiting early warning signals of academic difficulty—declining engagement, frequent errors, or gaps in foundational knowledge. The dashboards surface these insights to instructors and academic advisors, enabling targeted interventions before students fall significantly behind.
Adaptive systems close the feedback loop, automatically adjusting content difficulty, recommending supplementary resources, or modifying assessment strategies based on observed learning patterns. This personalization scales instructional support beyond what human educators can provide through individual attention alone.
5. Technology Stack: The Foundation for Scalability
Implementing real-time intelligence dashboards at enterprise scale requires technology selections that address competing demands for performance, reliability, and operational efficiency.
Apache Kafka provides the foundational streaming platform for most implementations. Its distributed architecture scales horizontally to handle petabyte-scale data volumes while maintaining ordering guarantees and replication for fault tolerance. Kafka Connect provides pre-built integrations with hundreds of data sources and sinks, accelerating implementation timelines.
Apache Flink has become the preferred stream processing framework for complex event processing requirements. Flink's stateful processing model supports sophisticated windowing operations, exactly-once semantics, and event-time processing that handles out-of-order data—common in distributed systems. Its low-latency processing enables dashboards with sub-second refresh rates.
Snowflake serves as the analytical data warehouse for many organizations, providing separation of compute and storage that enables independent scaling. Its support for semi-structured data simplifies the ingestion of JSON event streams, while its query optimization handles analytical workloads that join real-time metrics with historical context.
TensorFlow Serving and PyTorch Serve provide production-grade model serving infrastructure. These platforms handle the operational complexity of deploying machine learning models at scale—version management, request batching for GPU efficiency, model warming to reduce cold-start latency, and monitoring to detect model degradation.
Grafana and Apache Superset emerge as leading visualization platforms, providing flexible dashboard development environments that connect to diverse data sources. Their plugin architectures enable customization while their declarative configuration models support version control and automated deployment.
The technology selections increasingly emphasize managed services that reduce operational overhead. Cloud-native offerings including AWS Kinesis Data Analytics, Azure Stream Analytics, and Google Cloud Dataflow provide stream processing capabilities without requiring teams to operate and scale underlying infrastructure.
6. Challenges and Strategic Solutions: Building Resilient Real-Time Systems
Real-time intelligence dashboards introduce architectural complexity that manifests as operational challenges requiring deliberate solutions.
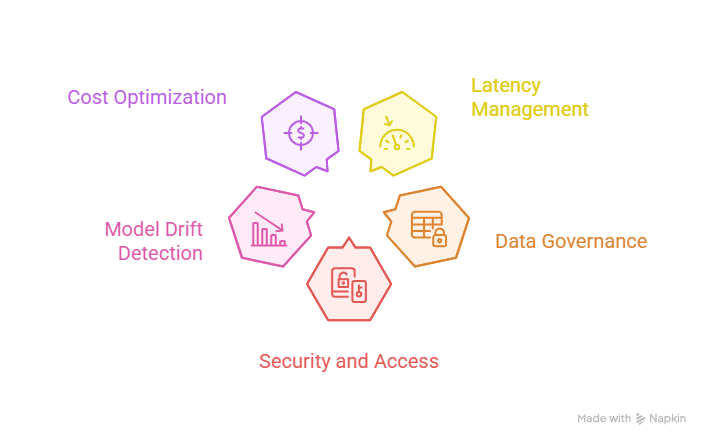
6.1 Latency Management
End-to-end latency—the delay between event occurrence and dashboard reflection—accumulates across processing stages. Network transmission, stream processing operations, database writes, and visualization rendering each contribute milliseconds or seconds. Organizations must establish latency budgets and systematically optimize each stage.
Solutions include co-locating processing infrastructure to reduce network hops, implementing in-memory processing to eliminate disk I/O, using columnar data formats that compress efficiently, and employing progressive rendering techniques that display partial results while background processing continues.
6.2 Data Governance and Lineage
Real-time systems complicate data governance because data flows through multiple transformation stages before reaching dashboards. Establishing data lineage—understanding which source systems contributed to each metric—becomes critical for trust and auditability.
Modern solutions implement metadata management systems that track data flows across the pipeline. Apache Atlas and OpenMetadata provide centralized catalogs that document schemas, transformations, and dependencies. These systems enable impact analysis—understanding which dashboards will be affected when source systems change—and provide the audit trails required in regulated industries.
6.3 Security and Access Control
Real-time dashboards often consolidate sensitive information from multiple systems, creating security challenges. Organizations must implement defense-in-depth strategies that secure data at rest, in transit, and during processing.
Solutions include encrypting data streams using TLS, implementing row-level security that filters dashboard data based on user roles, tokenizing sensitive fields in streaming pipelines, and deploying private network architectures that prevent external access to data infrastructure. Zero-trust architectures that authenticate every request regardless of network location have become the recommended approach.
6.4 Model Drift Detection
Machine learning models that power predictive dashboards degrade over time as data distributions shift. This model drift introduces silent failures where dashboards continue displaying predictions but with declining accuracy.
Solutions implement automated monitoring that compares model predictions against observed outcomes, tracking metrics including accuracy, precision, recall, and calibration. Statistical tests detect significant degradation, triggering automated retraining workflows or alerting data science teams. Leading implementations deploy shadow models—challenger models that generate predictions alongside production models—to continuously evaluate alternatives.
6.5 Cost Optimization
Real-time processing infrastructure can generate substantial cloud computing costs, particularly when processing high-volume event streams or executing inference on computationally intensive models. Organizations must balance responsiveness against cost efficiency.
Strategies include implementing tiered processing where lightweight transformations occur in real-time while expensive operations run in near-real-time batches, using auto-scaling policies that dynamically adjust capacity based on load, compressing data streams to reduce storage and network costs, and optimizing model architectures to reduce inference computational requirements.
7. The Future: Real-Time Dashboards as Autonomous Operational Centers
The trajectory of real-time intelligence dashboards points toward increasingly autonomous systems that not only surface insights but execute decisions and actions with minimal human intervention.
AI agents are among the fastest advancing technologies in 2025, and their integration into dashboard systems represents the next frontier. These agents will monitor dashboard metrics, recognize patterns that require intervention, generate action plans, and execute responses automatically.
40% of power and utilities control rooms are predicted to deploy AI-driven operators by 2027—a trend that will extend across industries. Financial services firms will deploy agents that automatically rebalance portfolios in response to market conditions. Supply chain systems will autonomously reroute shipments when dashboards detect disruptions. Manufacturing operations will self-optimize production schedules as demand patterns shift.
The implications for organizational structure are profound. Real-time intelligence dashboards will transition from decision support tools to decision execution platforms. The role of human operators will shift from monitoring and responding to exceptions toward designing decision frameworks, establishing guardrails, and handling edge cases that exceed algorithmic capabilities.
This evolution aligns with broader trends toward autonomous operations where intelligent systems manage routine functions while human expertise focuses on strategic direction, creative problem-solving, and handling novel situations that algorithms cannot anticipate. Organizations that successfully implement these systems will operate with efficiency, responsiveness, and scale that manual approaches cannot match.
8. Conclusion: Building the Intelligent Enterprise
Real-time intelligence dashboards have transcended their origins as visualization tools to become the operational command centers of AI-driven enterprises. They consolidate diverse data streams, execute machine learning inference at scale, and deliver actionable intelligence that enables decisions at the speed of business.
The organizations that will lead their industries in the coming decade are those implementing sophisticated real-time intelligence capabilities today. These systems provide competitive advantages that compound over time—faster response to market conditions, more efficient resource allocation, superior customer experiences, and operational leverage that scales beyond human capacity.
The technical foundation requires investment in streaming data infrastructure, machine learning operations, and visualization platforms. The organizational foundation requires cultivating data literacy, establishing governance frameworks, and building cross-functional teams that span data engineering, data science, and business operations.
For organizations beginning this journey, the imperative is clear: real-time intelligence dashboards are no longer optional capabilities that provide marginal advantages. They are foundational infrastructure that separates organizations capable of competing in AI-driven markets from those that will struggle to maintain relevance.
The path forward involves deliberate implementation of the architectural patterns, technology selections, and operational practices detailed in this analysis. Organizations that execute this transformation effectively will position themselves at the forefront of the intelligent enterprise era.